Confusion Matrix
To describe ROC(receiver operation characteristic) and AUC(area under curve), let’s begin with the confusion matrix:
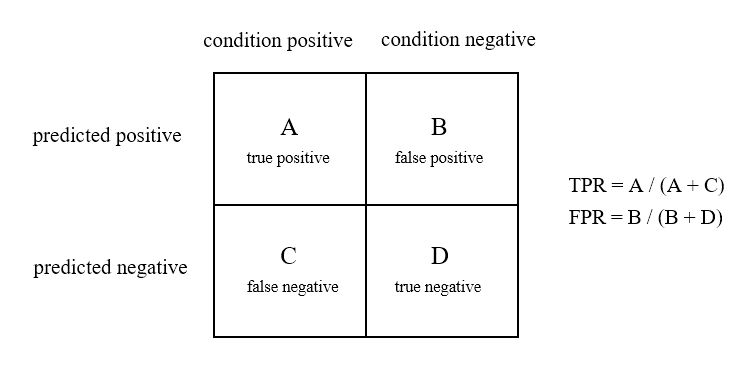
By drawing a confusion matrix, we can compute important model performance metrics such as TPR(true positive rate) and FPR(true negative rate).
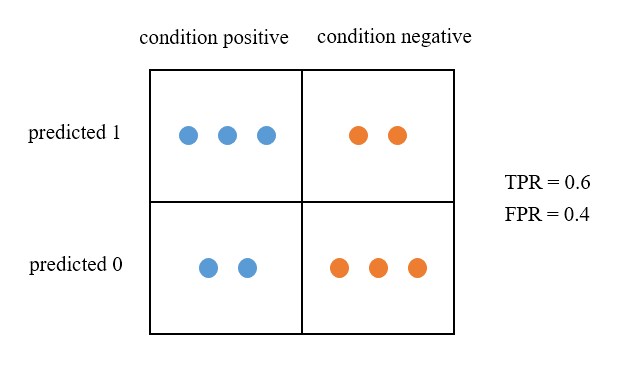
Let’s assume there are 10 observations of which 5 are condition positives (real positives, BLUE dots) and 5 are condition negatives (ORANGE dots). A classification model’s prediction can be mapped in the matrix like this:
Confusion Matrix for Regression Model with Decision Threshold
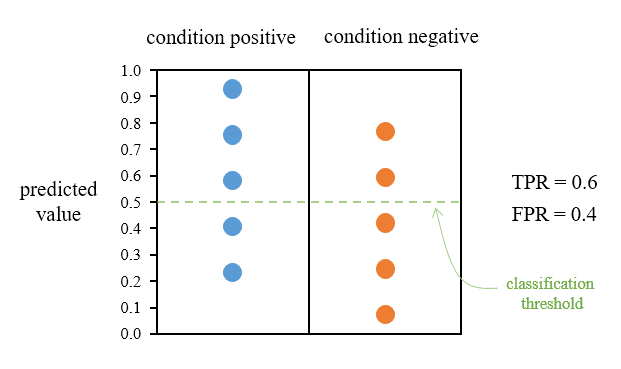
The confusion matrix is for classification models. But it can be extended for regression models with classification thresholds.
If there is a regression model that produces value ranging from 0 and 1, and 0.5 is the decision threshold, we can draw the confusion matrix for the model and measure TPR and FPR.
Like this:
ROC and AUC
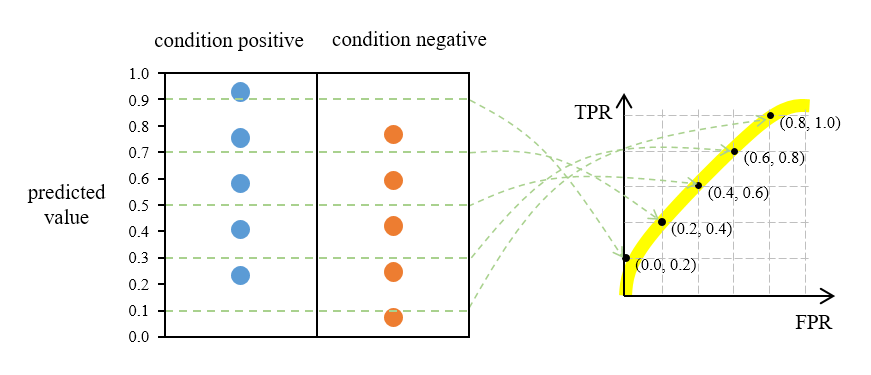
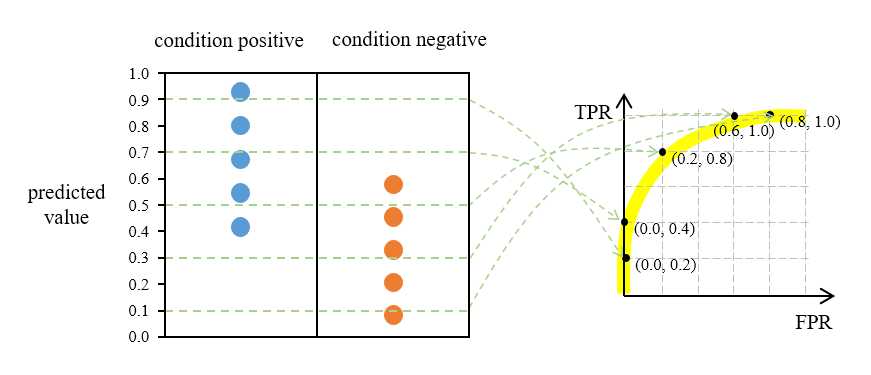
What if the model user selects different thresholds? The model performances (TPR, FPR) will change. And those changes can be marked on 2D coordinates where the axes are TPR and FPR.
Like this:
If we try hard and build a better model, it will behave like this:
If we try really hard and build a so-called perfect model, it will behave like this:
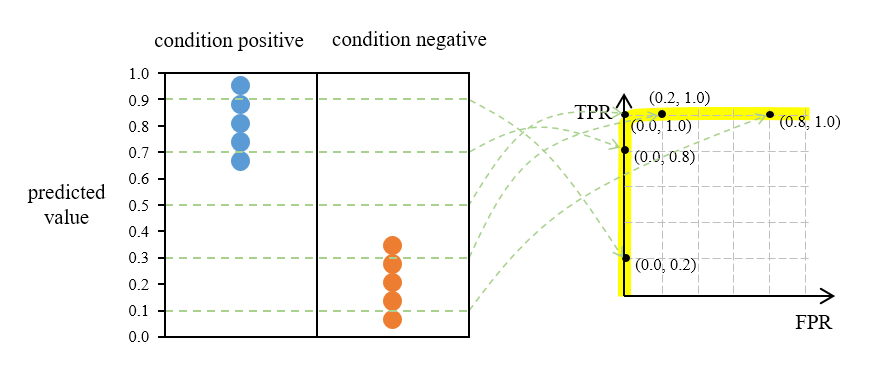
By the way, ROC-AUC denotes the area under the yellow curve. Its value is from 0 to 1 and the value around 0.7 means the model performance is not bad.